AMZN congressional disclosures are worth a separate look because Amazon sits in both retail portfolios and cloud-policy headlines—yet the PTR record in mid-2026 is mostly ordinary House rebalancing, not a coordinated buy wave. In the last 90 days, ProBors shows seven deduplicated Amazon rows filed between early May and mid-June 2026: six sales and one purchase, all from the House except a single Senate purchase filed in early April. Filing lag in this window runs from same-day to 34 days. This spotlight walks through those rows, how to read a multi-line sale batch, and what the record does not prove. It is research context, not investment advice.
Why Amazon shows up in congress trackers
Amazon is a common mega-cap holding, so PTR lines on AMZN often reflect portfolio maintenance rather than a policy bet on AWS or antitrust outcomes. Useful questions on Amazon are narrower:
- Which members filed AMZN activity in the last 90 days?
- Was each row a purchase, sale, or partial sale?
- How many days passed between the transaction date and the public filing date?
- Do multiple sale lines on the same filing date belong to one periodic report?
- Did House and Senate filings overlap in the same calendar window?
A ticker spotlight should answer those fields from source-backed rows, then let you decide whether deeper chart or insider review is warranted.
Recent AMZN filings in ProBors
The table below reflects Amazon PTR rows in ProBors as of July 19, 2026, with transaction dates from April 22 through June 16, 2026. Filing lag is calendar days between the transaction date and the filed date as reported in ProBors. Rows are deduplicated on politician, transaction type, dates, amount, and chamber.
| Politician | Type | Traded | Filed | Lag (days) | Amount range | Chamber | Signal |
|---|---|---|---|---|---|---|---|
| Matthew Robert Van Epps | Sale | June 16, 2026 | June 17, 2026 | 1 | $1,001 – $15,000 | House | Normal |
| David J. Taylor | Sale | June 5, 2026 | June 11, 2026 | 6 | $1,001 – $15,000 | House | Normal |
| Michael McCaul | Sale | May 28, 2026 | June 10, 2026 | 13 | $15,001 – $50,000 | House | Normal |
| Michael McCaul | Sale | May 26, 2026 | June 10, 2026 | 15 | $15,001 – $50,000 | House | Normal |
| Michael McCaul | Sale | May 7, 2026 | June 10, 2026 | 34 | $1,001 – $15,000 | House | Normal |
| Daniel Crenshaw | Sale | June 1, 2026 | June 1, 2026 | 0 | $1,001 – $15,000 | House | Worth watching |
| Gilbert Cisneros | Purchase | April 22, 2026 | May 7, 2026 | 15 | $1,001 – $15,000 | House | Normal |
Snapshot summary (trade dates since late April 2026): 7 deduplicated AMZN PTR rows—1 purchase and 6 sales, all House in this window. Median filing lag: 13 days (range 0–34 days). The largest disclosed ranges in this sample are Rep. Michael McCaul’s two $15,001 – $50,000 sale lines filed together on June 10, 2026.
Always verify individual rows against the official source before citing them:
- House PTR search: disclosures-clerk.house.gov
- Senate eFD search: efdsearch.senate.gov
Cross-chamber patterns worth noting
Three patterns stand out in this Amazon sample—and none of them are trading signals on their own.
1. Multi-line sale batches need to be read as one filing event
Rep. Michael McCaul’s three AMZN sales—traded May 7, May 26, and May 28, 2026—all posted on June 10, 2026. That is one periodic disclosure window, not three separate market-timing decisions spread across a month. When you see several sale lines with the same filed date, group them before building a narrative about “repeated selling.”
2. Filing lag varies more than direction
Rep. Daniel Crenshaw’s June 1 sale was filed the same day. Rep. McCaul’s earliest line in this batch shows a 34-day gap between the May 7 trade and the June 10 filing. Same ticker, same member, different lag on different lines—another reason to log both dates for every row. See the STOCK Act filing delay guide for the legal 30/45-day framework.
3. Senate activity exists but is thinner in this window
The 90-day table above is House-heavy. ProBors also shows Sen. John Fetterman’s Senate purchase on AMZN—traded March 30, 2026 and filed April 3, 2026—in a slightly earlier window. That row does not move with the June House sale cluster; mega-cap names often appear across chambers on unrelated schedules. The research task is to separate coincident calendar overlap from causation, not to treat every AMZN line as one story.
How to research AMZN on ProBors
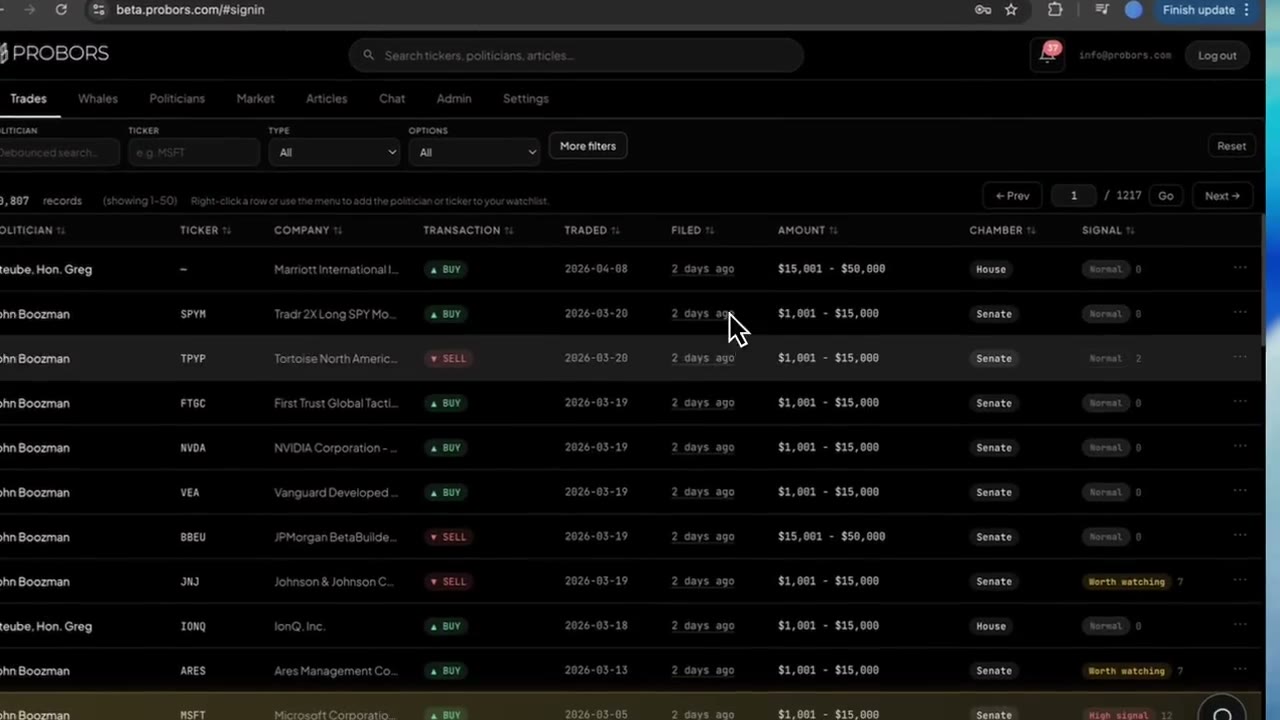
Use a ticker-first workflow when Amazon is already on your watchlist:
- Open Market → AMZN (or search
AMZNin the dashboard). - Scroll to the Congress trades table and sort by filed date.
- Click a row to open trade context—transaction type, amount range, chamber, and signal tier.
- Group rows that share the same filed date before comparing politicians.
- Toggle congress markers on the price chart to see where disclosures landed relative to daily bars.
- Cross-check Form 4 / whale activity on the same ticker before treating a PTR row as isolated.
- Add AMZN to a watchlist if you want alerts on the next filing—not on live price.
For chart marker details, see the market chart congress markers guide. For the full ticker workspace layout, see the market workspace guide.
What this AMZN data does not prove
A congressional disclosure table on Amazon does not prove:
- That members traded on non-public information
- That AMZN will rise or fall because a PTR was filed
- Exact share counts or dollar proceeds (ranges are bands, not precise fills)
- Real-time intent—most rows in this sample posted days or weeks after the transaction date
- Committee influence or antitrust policy outcomes tied to a single trade line
PTR data is a public record for transparency, not a timing edge. The useful output is a verified research trail: who filed, what type, when it traded, when it became public, and how that row compares to other disclosures on the same ticker.
FAQ
Why are most recent AMZN rows sales?
In this 90-day window, six of seven deduplicated rows are sales. That reflects what was filed—not a market forecast. Members rebalance holdings for many reasons unrelated to short-term price views.
How should I read McCaul’s three AMZN sale lines?
Treat them as one June 10 filing batch covering trades from early and late May. Summing amount ranges across lines overstates precision; use the ranges as magnitude bands only. See why congressional amount ranges are not exact dollars.
Does a “Worth watching” signal tier mean Amazon is a buy or sell?
No. Signal tiers in ProBors flag disclosure patterns worth a closer read—timing, size band, or filing context—not investment recommendations. Always open the original PTR before sharing a row.
Can I compare AMZN congress trades with insider Form 4 filings?
Yes, and you should when the question is whether political and insider activity overlap on the same ticker. ProBors keeps congress and insider rows in one workspace so you do not have to rebuild context in separate tools.
Where do I check whether ProBors has ingested the latest AMZN filing?
Open the ProBors data status page for ingestion health, then confirm any row against the official House or Senate disclosure portal.
Research AMZN disclosures in one workspace
Search Amazon PTR rows, compare filing lag, and cross-check insider activity on ProBors.
Get startedRelated reading
- Track congress stock trades by ticker
- MSFT congressional disclosures explained
- How to research a ticker across House and Senate
- How to read politician trade disclosures
- STOCK Act filing delay explained
Sources
- House Financial Disclosure search — official PTR source for House members
- Senate eFD search — official Senate disclosure portal
- STOCK Act (Pub. L. 112-105) — statutory basis for congressional financial disclosures
- ProBors data status — ingestion health for disclosure rows
- Rows were checked in ProBors and should be verified against the original filing.
Sources & methodology
Last updated:
ProBors uses public disclosure records, SEC filings, House and Senate financial disclosure portals, market data, and in-product workflow checks. Articles are written as research education, not investment advice.