The ProBors Market workspace is the ticker-centric research hub inside the Market tab. Instead of jumping between a quote site, a congress tracker, and an insider screener, you open one symbol and get price context, company facts, a disclosure chart, paginated congress and Form 4 tables, headlines, and peer chips on a single scrollable page.
This guide covers the full workspace workflow—not just chart markers (see the market chart guide for overlay details). It is a product walkthrough, not investment advice.
Where the Market workspace lives
After signing in, open the Market tab in the dashboard. Two sub-views appear at the top:
| Sub-view | Best for |
|---|---|
| Workspace | Deep ticker research (this guide) |
| Heatmap | Sector breadth—click a tile to jump into workspace on that symbol |
You can also land on a ticker from global search, a congress trade row, a whale context screen, or a heatmap tile. Deep links use /?tab=market&marketTicker=NVDA so the workspace loads the symbol you picked.
Step 1: Pick a ticker from the quote strip
The sticky header strip has three zones:
- Ticker search — type a symbol and select from suggestions
- Live quote — last price, day change, mini sparkline, company name
- Stock analysis — opens the dedicated AI equity brief for the active symbol
When WebSocket or enriched snapshot data is available, a Live badge appears on the strip. The quote panel below expands into session OHLCV, bid/ask, volume, and last-trade timestamps.
Tip: If quotes fail to load, check data status for Polygon or snapshot health before assuming the ticker is wrong.
Step 2: Read company context before disclosures
Scroll past Quote & session to the Company panel. This block answers structural questions before you interpret a filing:
- Sector, industry, SIC, exchange, list date
- Market cap and employee count
- Homepage link and address when available
- Business description paragraph
Knowing whether a name is a mega-cap platform stock or a thinly traded issuer changes how you weigh a single congress row or whale print.
Step 3: Use Price & disclosures as the timing anchor
The Price & disclosures panel is the visual center of the workspace. It combines:
- Chart window presets — 1M, 3M, 6M, 1Y, 2Y, 5Y
- Congress / Insider toggles — triangles for STOCK Act rows, diamonds for Form 4-style insider prints
- Full chart link — opens
/chart/{TICKER}for candles, drawing tools, and longer history - Window return — price change over the selected preset
Click a marker to open the disclosure context modal. When multiple filings share one marker (same ticker, date, and side), the chart dims and a picker asks which row to open—press Escape to close.
For marker semantics and keyboard shortcuts on the full chart, see ProBors market chart congress markers.
Step 4: Scan technicals and dividends for regime context
Below the chart, Technicals surfaces moving averages (20/50/200), RSI14, 52-week range, volatility, and return windows (1d through 252d). Dividends lists recent ex-dates, pay dates, and cash amounts.
These panels do not replace a full quant stack, but they help you ask better questions: Was the politician buying into a pullback or chasing a breakout? Did the insider sell after a dividend date?
Step 5: Work the congressional trades table
The Congressional trades section lists STOCK Act rows for the active ticker (default lookback: 180 days, 50 rows per page). Columns include politician, transaction type, traded date, filed date, amount bracket, chamber, and signal score.
| Action | What it does |
|---|---|
| Click a row | Opens the trade context modal (performance vs disclosure, chart focus, watchlist actions) |
| Row menu | Add politician or ticker to your watchlist |
| Pager | Move through additional pages when total count exceeds page size |
High-signal rows are visually highlighted. Pair this table with trade signal scores when you need a prioritization lens across many tickers—the workspace table is ticker-scoped; the Trades tab is market-wide.
Always compare traded date vs filed date. Filing lag is normal under the STOCK Act and does not mean the data is stale—it means you are seeing when the public record arrived.
Step 6: Review insider / Form 4 trades on the same symbol
The Insider / Form 4 trades block mirrors the congress table: insider name, title, transaction type, quantity, price, notional value, date, and signal tier. Click a row for the whale context modal; use the row menu to watchlist the insider or ticker.
Running congress and insider lists side by side on one ticker is the core workspace advantage. A senator's purchase and a CFO sale in the same month tell different stories—seeing both without re-searching saves time.
Step 7: Use the right rail for peers and headlines
The sidebar holds two quick-pivot panels:
Peers — chip buttons for related tickers. Click a peer to reload the entire workspace on that symbol (quote, chart, tables, news). Useful when a disclosure names a supplier or competitor you do not follow yet.
Headlines — recent news with per-ticker sentiment labels (positive, neutral, negative) when insights are available. Article links open in a new tab; related ticker tags let you hop to another workspace in one click.
Step 8: Branch to Stock analysis or full chart
Two escalation paths when the workspace surface is not enough:
| Path | When to use it |
|---|---|
| Stock analysis (strip button) | You want a structured AI equity brief with optional congress inclusion at standard or deep depth |
| Full chart (panel link) | You need candlesticks, log scale, MA overlays, fib/trend tools, or multi-year history |
The workspace is for integrated triage; Stock analysis and the full chart are for deeper single-symbol work. The AI research assistant remains the right tool for cross-ticker questions ("top congress purchases this week").
Heatmap → workspace handoff
Switch to the Heatmap sub-view for S&P 500, Nasdaq 100, or Dow 30 sector maps. Tile color reflects day change; tile size reflects market cap. Clicking a symbol opens the workspace on that ticker—handy when you start from sector rotation and drill into names with fresh congressional or insider activity.
A repeatable daily workflow
- Open Market → Workspace on a watchlist ticker (or pick one from heatmap breadth)
- Scan the quote strip and company block for context
- Toggle congress and insider markers; click anything that clusters near a price inflection
- Read the paginated tables for rows the chart did not surface
- Check headlines for narrative risk around the same window
- Add tickers or politicians to your watchlist from row menus
- Escalate to Stock analysis or full chart only when a row deserves more time
What the workspace does not prove
- Not causal — Disclosures appearing near a price move do not prove the filer predicted it.
- Not real-time — STOCK Act and Form 4 data arrive after transaction dates; the Live quote badge is market data, not filing latency.
- Not exact dollars — Congressional amount columns are statutory brackets.
- Not exhaustive — Page size and lookback windows limit what appears; use the Trades and Whales tabs for market-wide screens.
Official sources remain authoritative: House Clerk financial disclosures, Senate eFD search, and SEC EDGAR.
FAQ
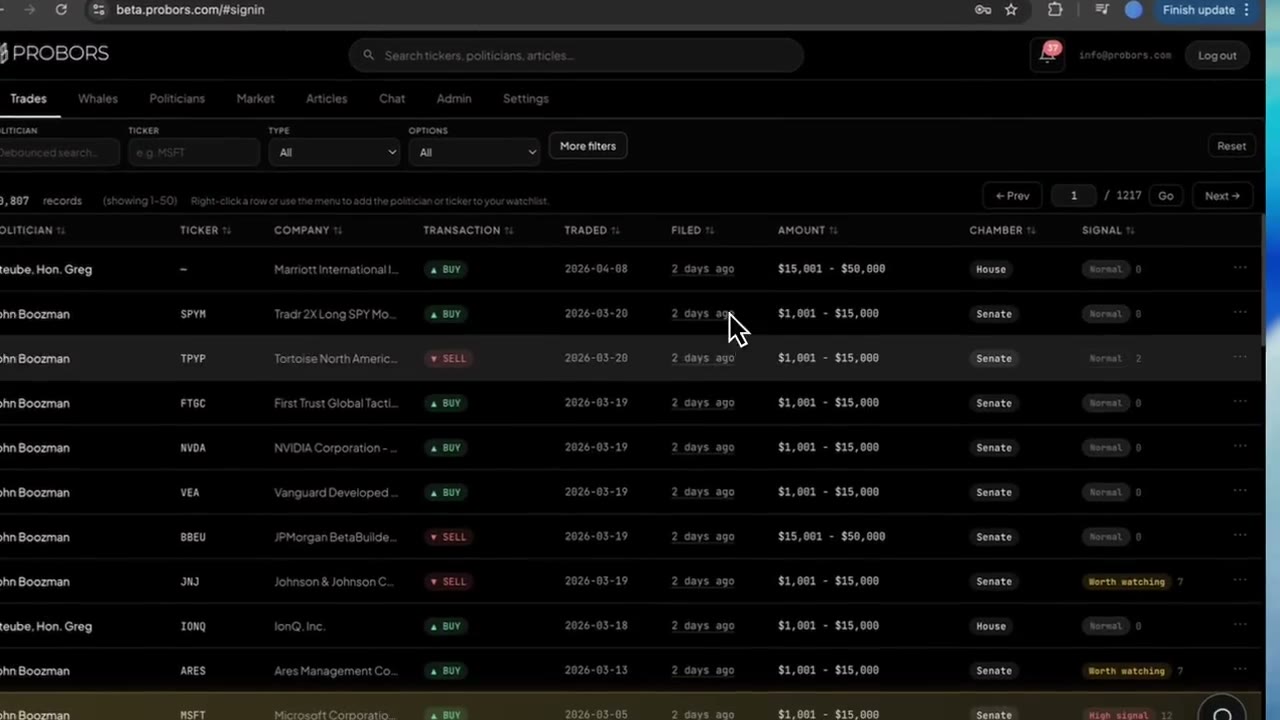
How is Market workspace different from the Trades tab?
Trades is a market-wide congress screener with rich filters. Market workspace is ticker-scoped: one symbol, price context, chart, both disclosure tables, news, and peers together.
Can I open workspace from a congress trade row?
Yes. Trade detail and context modals link to the ticker in Market. That handoff preserves the symbol so you land in workspace without retyping.
Does workspace share data with signal scores and watchlists?
Yes. Congress and insider rows come from the same tables that power signal scoring, watchlist alerts, and AI tools—only the presentation is ticker-centric.
Why do I see "No congressional trades in range"?
The ticker may have no STOCK Act filings in the configured lookback, or data ingestion may still be catching up. Confirm on data status and try the Trades tab for a broader search.
Open the Market workspace on your next ticker
Search a symbol on ProBors, review congress and insider tables beside live price context, and click any row for full disclosure detail.
Get startedRelated reading
Sources & methodology
Last updated:
ProBors uses public disclosure records, SEC filings, House and Senate financial disclosure portals, market data, and in-product workflow checks. Articles are written as research education, not investment advice.