ProBors market charts put congressional and insider disclosures on the same price timeline you already use for ticker research. Instead of opening a filing in one tab and a chart in another, you see when disclosed activity lines up with daily or intraday price action—and click a marker to open the underlying row.
This guide walks through the Market workspace chart, marker types, clustering behavior, and the full-page advanced chart. It is a product workflow guide, not investment advice.
Where to find the chart in ProBors
Two entry points cover most research:
| Surface | Best for |
|---|---|
Market → ticker detail (/market/{TICKER}) | Quick price window with congress + insider toggles |
Full chart (/chart/{TICKER}) | Candles, longer history, keyboard shortcuts, MA overlays |
Start from a congress trade row or whale transaction and open the ticker in Market. The Price & disclosures panel loads OHLCV bars with optional marker overlays. Use Full chart when you need multi-month history, log scale, or drawing tools.
Marker legend: what the shapes mean
ProBors uses consistent marker styling across the Market panel and advanced chart:
| Marker | Source | Typical meaning |
|---|---|---|
| Triangle | Congressional STOCK Act disclosure | Politician buy or sell on the transaction date |
| Diamond | Insider / whale (Form 4-style) | Large insider transaction on the filing timeline |
Congress and Insider checkboxes (Market panel) or rail buttons (full chart) toggle each layer independently. Shortcut keys on the advanced chart: C for congress, I for insider.
Same-day, same-side filings on one ticker merge into a single marker. Marker size reflects combined notional when the platform can estimate it. Click the marker to open details; if several filings share one marker, the chart dims and you pick which row to inspect (Escape closes the picker).
A practical read workflow
Use this sequence when a ticker already has disclosure activity:
- Open the ticker in Market and set the chart window (preset chips such as 1M, 3M, 6M, 1Y).
- Enable Congress and Insider overlays.
- Scan for markers near price inflection points—not because the filing caused the move, but to see whether disclosed activity happened before, during, or after a run.
- Click a marker and note transaction date, filed date, amount bracket, and politician or insider name.
- Cross-check the trade list below the chart or open Full chart for a wider window.
- If the row is worth tracking, add the ticker or politician to your watchlist.
Markers plot on transaction date for congress rows where that field exists. Filing lag still applies: a marker on March 19 does not mean the public knew on March 19.
Full advanced chart features
The /chart/{TICKER} page is built for repeat researchers:
- Interval and range controls load additional bar history (pagination fetches older and newer chunks).
- Congress / insider rails mirror the Market toggles with keyboard shortcuts.
- MA20 / MA50 moving averages help separate trend context from one-off disclosure dots.
- Log scale (shortcut L) for wide-range names.
- Chart settings gear stores appearance preferences locally.
The chart combines OHLCV price bars with matching congressional and insider markers for the selected ticker and time window.
Example: NVDA disclosure density (production snapshot)
The table below is a read-only snapshot from ProBors production data pulled 2026-06-17 07:03 UTC with congress and insider markers enabled over a roughly 90-day daily window. It illustrates how many markers can appear on a liquid mega-cap—not a trade recommendation.
| Metric | Value |
|---|---|
| Congress markers (matching window) | 452 |
| Insider / whale markers (matching window) | 1,714 |
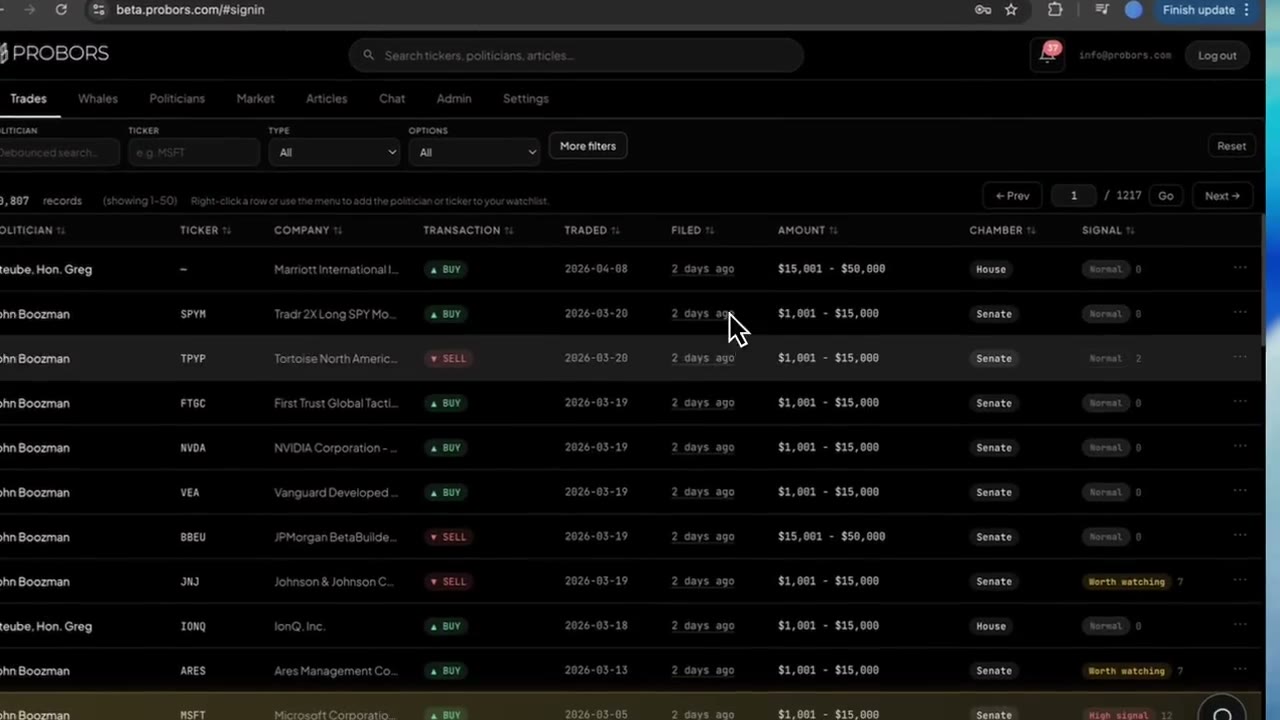
| Sample congress row | John Boozman · BUY · 2026-03-19 · $1,001–$15,000 |
| Sample congress row | Moore, Hon. Tim · SELL · 2026-03-24 · $15,001–$50,000 |
High marker counts are normal on widely held tickers. The chart helps you triage which dots deserve a click, not which trades to copy.
Pair markers with signal scores and AI
Markers show when activity happened on price. Trade signal scores help you decide which congress rows to open first. ProBors AI can chart a ticker or table recent disclosures:
- "Chart NVDA daily for six months with congress context"
- "List NVDA congress sells in the last 90 days as a table"
Use AI for batch questions; use the chart when you need spatial context on timing.
What chart markers do not prove
- Not causal proof — A buy marker before a rally does not mean the politician predicted the move.
- Not real-time — STOCK Act filings arrive days or weeks after the transaction date.
- Not exact dollars — Amount columns are statutory brackets, not precise trade sizes.
- Not every account — Spousal or dependent trades may appear under different owner labels; always read the source disclosure.
Official congressional filings remain authoritative: House Clerk financial disclosures and Senate eFD search. SEC insider filings: EDGAR search.
FAQ
Why do multiple politicians share one marker?
Same ticker, same transaction date, and same side (buy or sell) merge for readability. Click to disambiguate individual filings.
Can I hide insider markers and show only congress?
Yes. Toggle Insider off in Market or press I on the full chart to hide whale diamonds while keeping congressional triangles.
Does the Market panel use the same data as the trade search?
Yes. Markers come from the same congress and whale tables that power trade search, signal scores, and watchlist alerts.
Free tier chart access?
Market quotes and chart depth depend on your plan and Polygon configuration. Check data status if bars fail to load.
Open a ticker chart with disclosure markers
Search a symbol on ProBors, enable congress and insider overlays, and click any marker to read the filing behind the move.
Get startedRelated reading
Sources & methodology
Last updated:
ProBors uses public disclosure records, SEC filings, House and Senate financial disclosure portals, market data, and in-product workflow checks. Articles are written as research education, not investment advice.