The ProBors disclosure context window opens when you click a congressional STOCK Act row or a whale insider transaction anywhere in the signed-in dashboard. Instead of copying fields into a spreadsheet, you get trade date, filing date, chamber or SEC code, signal score with reasons, a focused price chart, and parsed disclosure fields in one modal. Use it as the verification step after a table filter—not as a substitute for the original House PTR, Senate periodic report, or Form 4 PDF. This is research context, not investment advice.
Quick answer
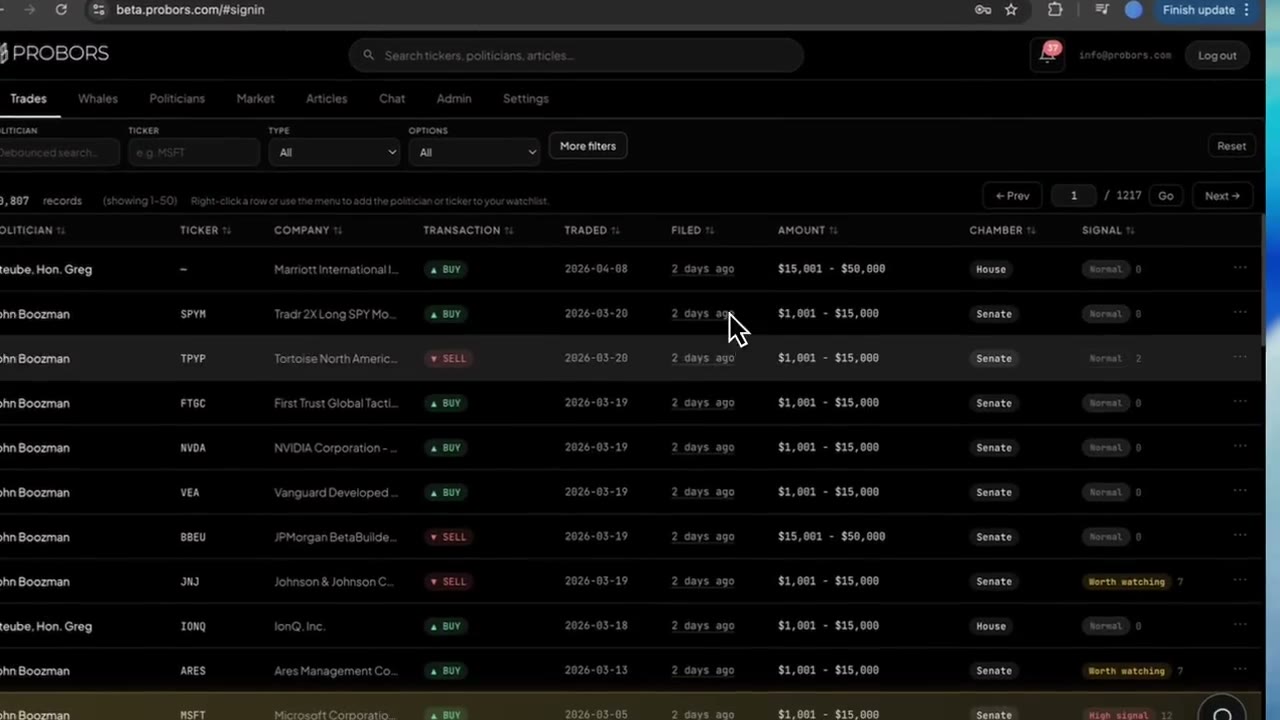
Open the context window from the Congressional trades table, Whales table, a politician profile disclosure row, or a chart marker in the Market workspace. Read the hero strip first (side, amount bracket or notional, price per share, estimated value), then the Timeline & source block for filing lag. Expand Disclosure detail when the row involves options, bonds, or non-standard asset labels. Jump to the politician profile or Market workspace from the header links, or add the ticker or member to your watchlist before you close the panel.
Where the context window opens
The same modal loads regardless of entry point—only the left-side record cards change between congress and insider variants.
| You click from… | What loads |
|---|---|
| Congressional trades feed | Congress trade hero, House or Senate source, STOCK Act fields |
| Whales / insider table | Insider name, title, SEC transaction code, share count and value |
| Politician profile → Disclosures | Same congress layout with profile navigation already one click away |
| Market workspace chart marker | Trade or insider row tied to that date and ticker; picker appears when multiple rows share one marker |
Press Escape or click outside the panel to close. If a chart marker stacks several filings on one day, ProBors dims the chart and asks which row to open—pick the line you intend to verify, not the first match by default.
Step 1: Read the hero strip before the chart
The top card answers “what happened?” in plain language:
Congress rows show purchase vs sale badges, the statutory amount bracket, optional derivative summary text, price per share when ProBors can estimate it, estimated dollar value, and percentage change since a reference close.
Insider rows show the reporting person, corporate title, open-market or plan language, SEC transaction code letter, share quantity, trade price, and total transaction value.
Skim this block before scrolling to the chart. A small amount bracket with a high signal label still deserves a lag check; a large whale print with a routine code may be a scheduled sale rather than a discretionary bet.
Step 2: Check timeline, source, and filing lag
The Timeline & source card (congress) or Dates card (insider) lists transaction date, filing date, and chamber or filing source.
Compute lag in whole days: if a senator traded in mid-May and the row filed in mid-June, that is roughly a month of public delay—not unusual for Senate batches, but important when you compare price action to disclosure timing. House PTRs often show shorter gaps when members file soon after the trade.
Cross-check these dates against the official PDF before you cite the row in notes or social posts. ProBors normalizes dates for sorting; the signed form is the legal record.
Step 3: Use signal reasons as a reading queue, not a verdict
When signal scoring is attached, the panel shows the numeric score, tier label (such as Normal or Worth watching), and a bullet list of reasons—first-time ticker for that member, nearby insider activity, cluster of disclosures, price move since trade date, and similar context flags.
Treat reasons as why this row surfaced, not proof of intent or future performance. Pair the score with how to filter congress trades by signal score when you are building a morning list; open the context window only for rows that survive your date and chamber filters.
For a deeper explanation of the scoring model, see ProBors trade signal scores.
Step 4: Expand disclosure detail for options and non-equity rows
Below the timeline, Filing details lists normalized fields ProBors parsed from the source form—asset type, raw transaction type, notes, and record identifiers useful for support tickets.
When options-related is true, additional rows appear for options type, strike, expiration, contract quantity, and underlying shares. Bond, municipal, fund, and real-estate labels may show asset-type text without a liquid ticker; the context window still helps you read the statutory description even when the symbol column shows a placeholder.
The Disclosure sub-panel mirrors House or Senate field groups when the ingest preserved structured detail. If a field is blank, the upstream form may not have carried it—absence is not confirmation that the activity did not occur.
Step 5: Read the price chart and performance footnotes
The right column loads a price window around the trade or filing date with a compact quote strip: last price, session change, and performance since the trade date or since the filing date when analytics are available.
Use the chart to ask timing questions: Did the market already move before the public filing? Was the politician buying into a drawdown or selling after a run? Insider rows follow the same layout with Form 4 dates anchored on the chart.
Footnotes under the chart explain which anchor close was used for percentage fields. If analytics are missing—illiquid ticker, stale quote, or data gap—ProBors shows an error message instead of a silent blank chart. Check probors.com/status when quotes fail across multiple symbols.
Step 6: Navigate out or add to watchlist
Header shortcuts keep research moving without re-searching:
- Politician profile (congress rows) opens the member’s disclosure history and portfolio snapshot tab.
- Ticker in Market opens the Market workspace on that symbol with congress and insider tables below the chart.
- Watchlist toggles add the politician, ticker, or insider entity for inbox alerts on the next filing.
Add to watchlist only after you have read the source PDF for the current row—alerts fire on new activity, not retroactive confirmation of what you already inspected.
Congress vs insider: what changes in the panel
| Element | Congress context window | Insider / whale context window |
|---|---|---|
| Hero identity | Politician name and photo | Insider name and corporate title |
| Primary dates | Traded vs filed + House/Senate source | Trade date vs SEC filing date |
| Size fields | Statutory amount bracket | Share qty, price, dollar value |
| Extra panels | Options and asset-type disclosure blocks | SEC code and security type |
| Typical next step | Politician profile or chamber compare | Cluster check on same ticker in Whales tab |
Run both panels on the same ticker when your question is “who moved first?”—congressional disclosure and Form 4 timelines rarely align on the same calendar day.
Common mistakes when using the context window
- Stopping at the chart without opening the official filing linked from your verification workflow.
- Treating signal reasons as trade instructions. They prioritize attention, not allocation.
- Ignoring amount brackets on congress rows. A $1,001–$15,000 line and a high six-figure bracket carry different research weight.
- Assuming missing tickers mean bad data. Some disclosures describe funds or trusts without a single equity symbol.
- Watchlisting before verification. Alerts help on the next event; they do not validate the row you are viewing.
FAQ
Does the context window replace the official PDF?
No. It aggregates parsed fields and market context for speed. Before publishing or trading on a row, open the House PTR, Senate periodic report, or SEC Form 4 from your normal verification path and match dates, amounts, and transaction types.
Can I open the context window from the full-screen chart?
Yes. Markers on the Market workspace Price & disclosures chart and on /chart/{TICKER} open the same modal. When several disclosures share one marker, use the picker to select the correct politician or insider line.
Why do percentage-change fields sometimes show a dash?
ProBors needs a valid price anchor and trade or filing dates to compute performance. Thinly traded symbols, missing quotes, or same-day filings without a settled close can leave the field empty rather than guessing.
Is signal scoring shown on insider rows too?
Yes, when the ingest attaches a score. Insider scoring emphasizes size, role, clustering, and timing relative to price—use it the same way as congress scores: triage first, verify on the source filing second.
How do I share a row responsibly?
The context window is for private research. If you export screenshots, redact account email, billing details, and any personal settings. Cite the official filing date and amount language from the source form, not only the ProBors summary card.
Open the row, then verify the filing
Sign in at probors.com, click any disclosure in your feed, and use the context window as the bridge between table triage and source PDF review.
Get startedRelated reading
- How to read politician trade disclosures
- ProBors politician profile guide
- ProBors Market workspace guide
- How to triage whale transactions on ProBors
Sources
- House Financial Disclosure search — Periodic Transaction Reports for representatives
- Senate eFD search — Senate periodic transaction reports
- SEC EDGAR search — Form 4 and other insider filings
- STOCK Act (S. 2038, 112th Congress) — congressional disclosure statute
- Rows described in this guide were checked against ProBors product screens and should be verified against the original filing.
- Ingestion health: probors.com/status
Sources & methodology
Last updated:
ProBors uses public disclosure records, SEC filings, House and Senate financial disclosure portals, market data, and in-product workflow checks. Articles are written as research education, not investment advice.