The ProBors politician portfolio gains view turns cached STOCK Act holdings into time-weighted return (TWR) percentages you can compare against the S&P 500 (SPY). Open a member’s portfolio snapshot, read the one-month and all-time KPIs, then flip the chart from dollar value to cumulative gains with a benchmark overlay. This is a product walkthrough for disclosure researchers—not a performance scorecard or investment advice.
Quick answer
Sign in at probors.com, open the Politicians tab, and choose a card with a portfolio snapshot. The portfolio screen shows 1M return (TWR), all-time return (TWR), and—when available—a dashed S&P 500 (SPY) line on the Gains chart. Use the Value / Gains toggle above the chart to switch between mark-to-market dollars and percent return. Pair this screen with the member’s Disclosures tab when you need trade-by-trade timing, not just portfolio-level context.
Where portfolio gains live in ProBors
Portfolio gains are tied to cached periodic holdings snapshots, not every PTR line item. You reach them from:
| Entry point | What you see |
|---|---|
| Politicians tab | Directory cards; members with snapshots show a one-month TWR chip on the card |
| Portfolio tab on a politician profile | Full snapshot with KPI row, sector pie, and Value/Gains chart |
| Politician profile → Portfolio snapshot | Same holdings table as the dedicated portfolio screen |
If a member has trade history but no snapshot yet, the Politicians card still opens Disclosures—gains KPIs appear only when ProBors has enough snapshot history to compute TWR.
What the gains numbers mean
ProBors labels returns as time-weighted return (TWR)—cumulative percent change on the disclosed holdings path, not a live brokerage balance.
- Anchor date — the starting point for the return series (for example, returns since March 25, 2026).
- As-of date — the latest snapshot date in the series (as of July 24, 2026 in current data).
- 1M / 3M / 6M / YTD / 1Y / All — windowed return percentages when enough history exists; blank cells mean the window is shorter than the member’s track record.
- S&P 500 (SPY) overlay — benchmark return on the same calendar windows and on the Gains chart (dashed gray line).
Amount brackets on individual trades still understate or overstate true size. Gains math uses snapshot holdings and reported values—see why congressional amount ranges are not exact dollars before you treat any return as precise.
Examples from current ProBors data
As of July 24, 2026, ProBors shows portfolio gains for members with snapshot coverage. These rows illustrate how the KPIs read—not a ranked “best traders” list:
| Politician | 1M TWR | All-time TWR | Anchor date |
|---|---|---|---|
| Mark Warner | +2.7% | +185.0% | March 25, 2026 |
| Rand Paul | +4.1% | +74.5% | February 26, 2020 |
| Jeffries, Hon. Hakeem S. | +0.3% | +1,274.4% | August 21, 2017 |
| A. McConnell | +5.1% | +71.5% | September 7, 2017 |
| Markwayne Mullin | −0.9% | +49.6% | December 29, 2025 |
Long all-time figures often reflect an early anchor and sparse early snapshots—not proof of skill. Short anchors (Warner, Mullin) mean one-month windows are more meaningful than multi-year comparisons. Always open Disclosures for the trades behind any spike.
Step 1: Scan the Politicians directory
Open Politicians from the signed-in header. Cards with portfolio snapshots show a 1M TWR badge when gains data is available—useful for a quick sort before you commit to a deep read.
- Search by last name if the directory is long.
- Prefer cards labeled with a portfolio snapshot over “No snapshot yet.”
- Click Portfolio on the card (or the card itself when a snapshot exists).
- Use Disclosures on the same card when you need recent PTR rows with signal scores.
For directory layout and watchlist shortcuts, see ProBors Politicians tab guide.
Step 2: Read the KPI row before the chart
The portfolio hero block summarizes orientation numbers:
- Disclosed net worth — statutory range text from the filing, not a bank statement.
- 1M return (TWR) — one-month cumulative return; subtext may show SPY for the same window and the point spread (for example, +2.0% vs SPY).
- All-time return (TWR) — cumulative return since the anchor date.
- Holdings · value — position count and estimated mark-to-market total from the latest snapshot.
- Buys / sells (reported) — aggregated notional from disclosure brackets.
- Returns since {anchor} · as of {date} — footnote tying the series to filing dates.
If the 1M KPI is green but SPY beat the portfolio by a wider margin, the spread line under the KPI tells you the member lagged the benchmark even on a positive month.
Step 3: Toggle Value vs Gains on the chart
Above the line chart, two pills control the series:
| Mode | Y-axis | Best for |
|---|---|---|
| Value | USD mark-to-market | Seeing how estimated portfolio size moved across snapshots |
| Gains | Percent cumulative return | Comparing politician path to SPY on the same dates |
In Gains mode, the solid line is the portfolio TWR and the dashed line is S&P 500 (SPY) when benchmark data loaded. Hover tooltips show both percentages on each date. Switch back to Value when you care about dollar scale (for example, after a large reported sale changes holdings).
Step 4: Cross-check holdings, sectors, and disclosures
Below the chart, ProBors may show:
- Sector allocation pie when holdings map to sectors
- Reported trade volume by year bar chart (buy vs sell notional from filings)
- Holdings table with ticker, weight, and estimated value
Click Open disclosures & live P/L to jump to the member profile’s PTR table. Use how to read politician trade disclosures for transaction vs filed dates, then politician portfolio tracking on ProBors for snapshot limitations.
Step 5: Track the member for the next filing
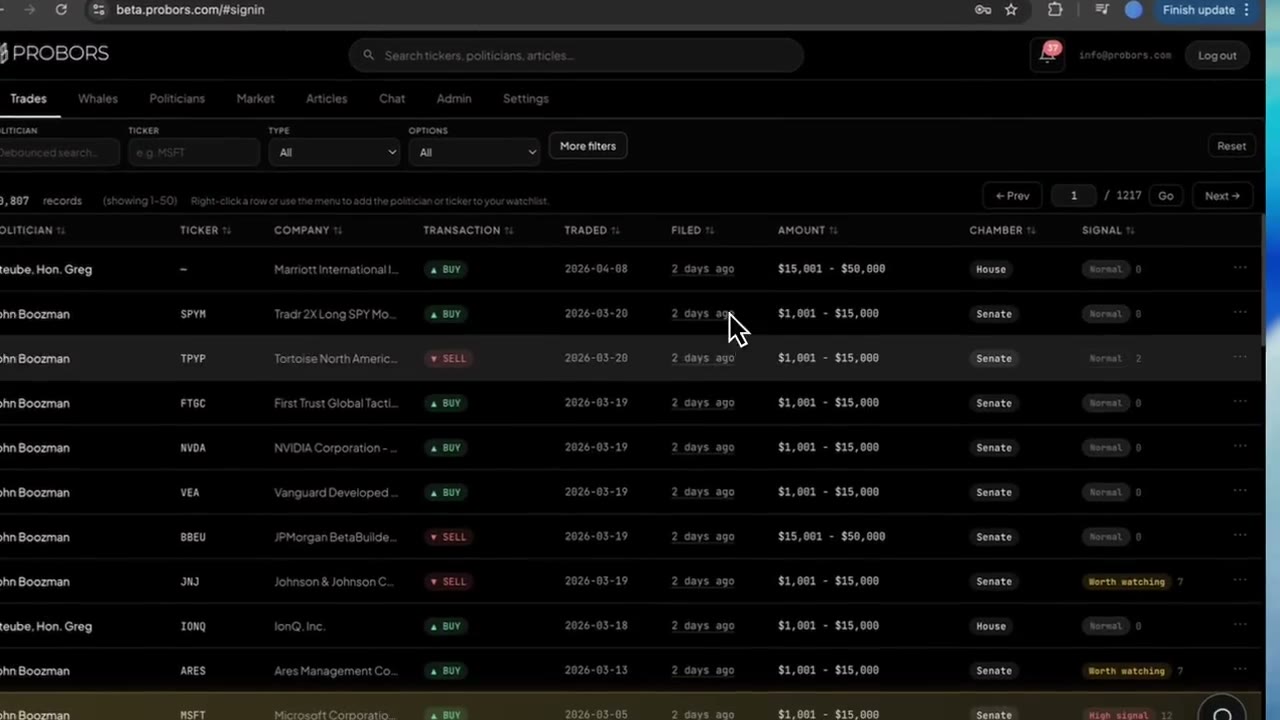
Use Track portfolio on the portfolio screen (or the Politicians card watchlist control) when you want email alerts on new trade rows. Gains KPIs do not update intraday—they refresh when new snapshots and return series land. Check probors.com/status if a expected filing is missing from the dashboard.
What this does not prove
Portfolio gains on ProBors are research context, not verified performance attestation.
- Returns depend on snapshot frequency, parsing, and market marks—not audited fund statements.
- Members can hold assets outside disclosed ranges, in spouse accounts, or in forms that do not map to tickers.
- TWR on a political portfolio does not prove access to non-public information or future returns.
- Beating or lagging SPY over one month is not evidence of skill; benchmark choice (large-cap US equities) may not match the member’s actual allocation.
Treat gains as a question generator—then verify holdings and trades on the original House or Senate PDF.
FAQ
Why is my politician’s all-time return extremely high?
Long anchors plus early, sparse snapshots can compound small reported positions into large percentage moves. Read the anchor footnote and open individual disclosures rather than treating all-time TWR as a leaderboard score.
What is the difference between portfolio gains and the Positions & P/L block on the profile?
Portfolio gains (this guide) summarizes time-weighted return across snapshot history with an SPY overlay. Positions & P/L on the Disclosures profile tab estimates reference-price context on individual tickers from recent rows. Use gains for portfolio-level trend; use Positions & P/L for line-item questions.
Can I see gains without a portfolio snapshot?
No. Gains require cached holdings history. Members with PTR activity only still appear in the Trades feed and politician Disclosures tab.
Does a positive 1M return mean the politician outperformed the market?
Not necessarily. Compare the KPI subtext for SPY and the Gains chart overlay. A positive month can still trail the benchmark if SPY returned more over the same window.
Is portfolio gains data available on the free tier?
Portfolio snapshots and gains require a signed-in session with data access for politician portfolios. Trade history on the main feed may still be visible on your plan; open Settings or pricing in the app for tier details.
Compare politician portfolio returns on ProBors
Open portfolio snapshots, read TWR vs the S&P 500, and cross-check disclosures in one workspace.
Get startedRelated reading
- Track politician stock portfolios on ProBors
- ProBors politician profile guide
- ProBors Politicians tab guide
- Why congressional amount ranges are not exact dollars
- ProBors data status page guide
Sources
- House Clerk Financial Disclosure — original PTR forms
- Senate eFD search — Senate periodic transaction reports
- STOCK Act (Pub. L. 112-105) — statutory disclosure framework
- Rows were checked in ProBors and should be verified against the original filing.
- Ingestion health: probors.com/status
Sources & methodology
Last updated:
ProBors uses public disclosure records, SEC filings, House and Senate financial disclosure portals, market data, and in-product workflow checks. Articles are written as research education, not investment advice.