When multiple politicians trade the same ticker, the useful question is not "Congress bought GOOGL" but which members filed, in which direction, on which transaction dates, and how long before the public saw each row. ProBors lets you filter congressional trades by ticker and then compare member-by-member—so a House purchase filed in August and a Senate sale disclosed months after an older trade date do not collapse into one narrative. This six-step workflow walks through that multi-member pass for disclosure researchers who need a clean table before writing or sharing. This is research context, not investment advice.
Why a ticker filter alone misleads
Liquid mega-caps appear in dozens of STOCK Act filings every quarter. A ticker search returns rows from different people, chambers, and filing batches—not a single coordinated trade.
Researchers compare members on the same symbol because:
- Direction often splits. One representative may report a partial sale while another reports a purchase in the same month—without any link between their portfolios.
- Filing lag varies by chamber and member. A same-week filing date can hide a Senate trade from the prior year next to a House line filed within days of the transaction.
- Amount brackets differ sharply. A $1,001–$15,000 purchase and a $50,001–$100,000 partial sale carry different portfolio weight even on the same symbol.
- Signal labels are row-level. Worth watching on one member's sale does not mean the ticker is "high signal" for every politician who touched it.
Multi-member ticker research is how you avoid turning overlapping GOOGL or MSFT disclosures into a false "Congress is bullish" headline.
Six-step workflow on ProBors
-
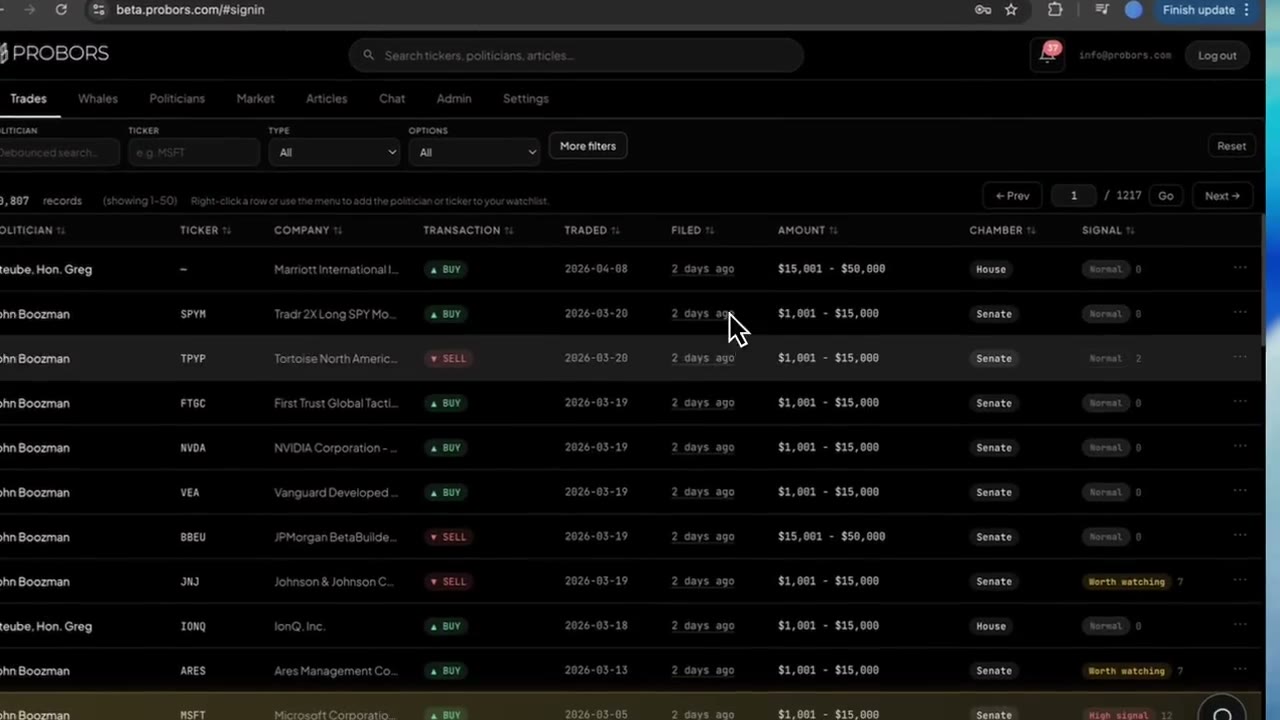
Open Congressional trades and filter by ticker. On probors.com, load the Trades view and search or filter for your symbol. Sort by filing date descending so the newest public batches appear first.
-
List unique politicians before reading direction. Scan the politician column and count distinct members. Note chamber (House vs Senate) for each name—you will compare within chamber before drawing cross-chamber conclusions.
-
Build a member × direction matrix. For each politician, log the most recent relevant row: transaction type (purchase, sale, partial sale, option), transaction date, filing date, amount bracket, and signal label if shown. Flag when two members took opposite sides in overlapping windows.
-
Compute filing lag per row—not per ticker. Express lag in plain language: "9-day lag on an August 11 trade filed August 20" or "485-day lag on an April 2025 Senate purchase filed in August 2026." Long Senate backlogs can dominate a ticker view while reflecting trades the market already absorbed.
-
Open each member profile for cluster context. A single GOOGL sale may be one line in a 13-ticker rebalance; a purchase may sit inside a multi-stock August cluster. Member history prevents over-weighting one row—see how to trace a politician's disclosure history on ProBors.
-
Verify, then watchlist or document. Open the original House PTR or Senate periodic report for any row you might cite. Add the ticker to a watchlist only after source checks; future filings append to this multi-member picture. For chamber-specific timing, pair with how to research a ticker across the House and Senate.
Examples from recent filings
Recent filings in ProBors as of September 1, 2026 show why a multi-member table beats a one-line summary. Alphabet (GOOGL) and Microsoft (MSFT) both had several politicians active in late summer—same symbols, different stories.
| Politician | Chamber | Ticker | Type | Traded | Filed | Lag | Amount range | Signal |
|---|---|---|---|---|---|---|---|---|
| Rulli, Hon. Michael | House | GOOGL | Sale (Partial) | August 24, 2026 | August 24, 2026 | 0 days | $50,001–$100,000 | Normal |
| Taylor, Hon. David J. | House | GOOGL | Purchase | August 11, 2026 | August 20, 2026 | 9 days | $1,001–$15,000 | Normal |
| Taylor, Hon. David J. | House | MSFT | Sale | August 11, 2026 | August 20, 2026 | 9 days | $15,001–$50,000 | Normal |
| McCormick, Hon. Richard Dean Dr | House | MSFT | Sale | July 30, 2026 | August 12, 2026 | 13 days | $1,001–$15,000 | Worth watching |
| John Boozman | Senate | MSFT | Purchase | April 22, 2025 | August 20, 2026 | 485 days | $1,001–$15,000 | — |
How to read this without merging members:
- Rulli GOOGL (partial sale, same-day filing) is a larger bracket trim filed the day of the trade—not comparable in size to Taylor's smaller purchase filed nine days later.
- Taylor GOOGL purchase and MSFT sale share an August 11 transaction date and August 20 filing—a routine rebalance pattern across two mega-caps, not a sector call.
- McCormick MSFT (Worth watching) is a separate House member with a different transaction window; the elevated label reflects row-level context in ProBors, not ticker-wide consensus.
- Boozman MSFT (Senate purchase) carries extreme filing lag—the April 2025 trade date was not public until mid-August 2026. That row belongs in a Senate backlog note, not a "fresh MSFT buying" headline alongside Taylor's August sale.
Use a table like this as a template: filter ticker → list members → split direction → log lag → open member profiles → verify PDFs.
Common mistakes when multiple members share a ticker
- Pooling purchases and sales into one net direction. Congress is not one portfolio; each filing stands alone.
- Treating same filing week as same trade week. Compare transaction dates inside each row.
- Assuming coordination from symbol overlap alone. Committee overlap and timing need evidence beyond matching tickers.
- Ignoring partial sales and options. A partial sale is not the mirror image of an outright purchase.
- Skipping the smallest bracket rows when a large partial sale exists. Both belong in the matrix.
What this does not prove
A multi-member ticker table shows who reported what, when it became public, and how directions diverged. It does not prove insider information, coordinated trading, committee foreknowledge, or a repeatable edge. Opposite-side rows on liquid names are common. Long-lag Senate lines may be fully priced in before disclosure. Amount brackets are ranges, not exact dollars. This is research context—not investment advice.
FAQ
Should I start with the ticker or the politician?
Start with the ticker when the question is "who in Congress touched this symbol recently?" Start with the politician when the question is "what did this member file lately?" For ticker-first work, always split by member before interpreting direction.
How many politicians on one ticker is "unusual"?
There is no fixed threshold. Mega-caps often appear in many portfolios. Unusual usually means overlapping transaction windows, same-direction clusters, large brackets, or committee context—not merely a count above two.
Does Worth watching on one row apply to the whole ticker?
No. Signal labels are assigned per disclosure row. Another member's Normal sale on the same symbol can file the same week.
How do I handle tickers with both House and Senate rows?
Log chamber separately, compare median lag per chamber, and avoid sorting only by filing date. See how to research a ticker across the House and Senate for a chamber-first variant of this workflow.
Where do I check whether ProBors has the latest filings?
Visit probors.com/status for ingestion health, then verify any row you cite against the original STOCK Act PDF.
Compare congressional disclosures by ticker
Filter trades by symbol, open member profiles, and cross-check House and Senate rows on ProBors.
Get startedRelated reading
- How to research a ticker across the House and Senate
- Track Congress stock trades by ticker
- How to filter Congress trades by signal score
- How to trace a politician's disclosure history on ProBors
Sources
- House STOCK Act financial disclosure information
- Senate financial disclosure reports
- STOCK Act (Pub. L. 112-105) overview — Congress.gov
- Rows were checked in ProBors and should be verified against the original filing.
- ProBors data status — ingestion health for congressional sources
Sources & methodology
Last updated:
ProBors uses public disclosure records, SEC filings, House and Senate financial disclosure portals, market data, and in-product workflow checks. Articles are written as research education, not investment advice.