Comparing back-to-back congressional disclosure weeks means measuring what entered the public record in week B against week A—not guessing whether “Congress turned bearish” from one equity sale. ProBors sorts rows by filing date, labels House vs Senate, and keeps trade dates separate so you can spot batch weeks, quiet follow-ups, and repeat tickers surfacing on different filing calendars. Use this seven-step workflow when you already run a weekly disclosure review and need sharper week-over-week notes. This is research context, not investment advice.
Why week-over-week framing beats headline reflex
Congressional PTR volume swings hard. A seventeen-row early-November filing window can jump to seventy-seven rows mid-month, then collapse to one row the following week—as November 2026 snapshots on ProBors illustrate. Three traps follow if you skip structured comparison:
- Treating row count as sentiment. More lines often mean one member filed a large batch, not that the institution bought or sold more stock.
- Ignoring chamber mix. A House-only heavy week followed by Senate periodic reports is a calendar story, not a data bug.
- Chasing tickers that only “reappear” on new filing dates while the trade date stayed fixed weeks earlier.
Back-to-back comparison answers a narrower question: did public disclosure activity change shape—volume, concentration, lag, asset mix—and what deserves a deeper PDF pass?
Seven-step comparison workflow on ProBors
-
Lock two adjacent filing-date windows. Define week A and week B as non-overlapping seven-day ranges on the filing date axis. Write both ranges in your memo before opening tickers. You are comparing when forms became public, not when trades occurred.
-
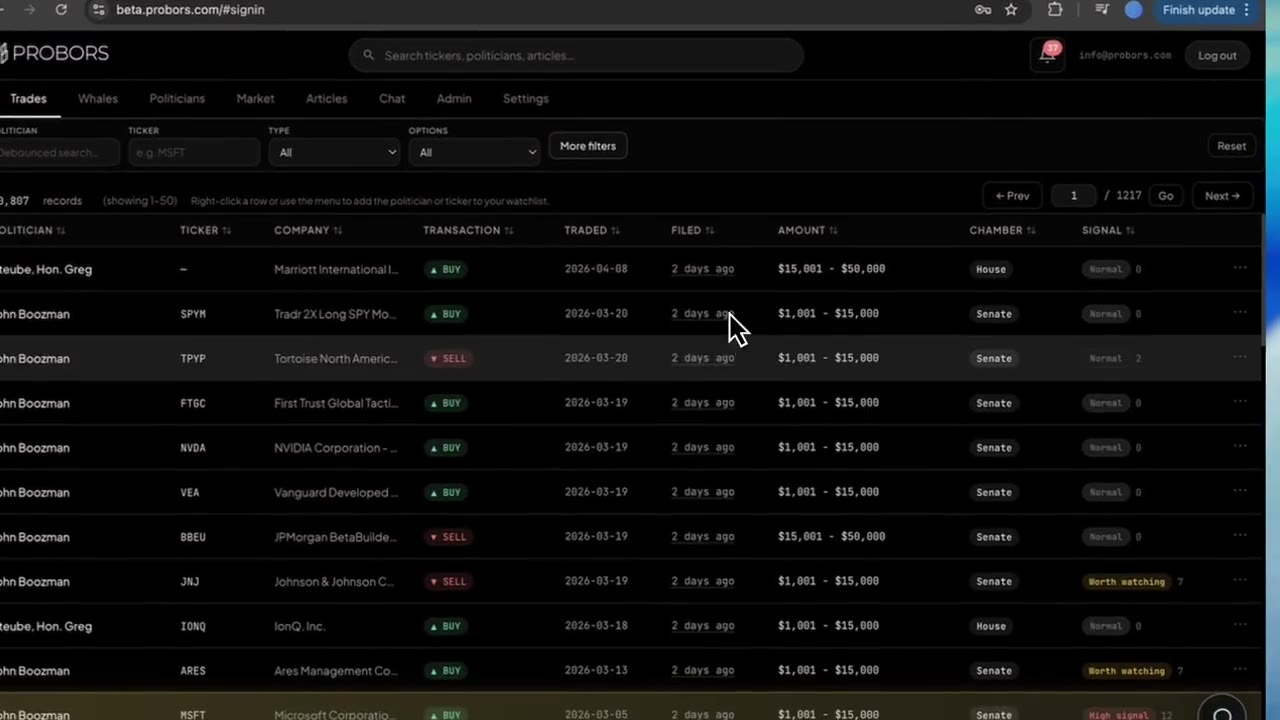
Pull baseline counts for each week. On probors.com, open Congressional trades, sort by filing date descending, and count deduplicated rows per window. Log distinct politicians with at least one line and the House vs Senate split. Note totals in a simple table—seventeen vs seventy-seven vs one is meaningful context, not a trading signal.
-
Score concentration, not just volume. For each week, list the top two filers by row count and their share of the total. Mid-November 2026 was concentrated: two House members accounted for most rows in that window. Early November spread activity across seven members with a smaller total. Concentration tells you whether week B deserves large-batch triage or a House-only quiet-week pass.
-
Compare lag distributions in plain language. For shortlisted rows, record transaction date, filing date, and lag in whole days. Contrast each week’s minimum, median, and maximum lag. A quiet week can still surface forty-day lag lines tied to an older trade date—late November’s single House filing behaved that way for Warner Bros. Discovery (WBD). Use filing lag screening so you do not describe stale trade dates as “this week’s activity.”
-
Track repeat tickers across weeks on trade date. Search a ticker that appeared in both windows and group by trade date, not filing date. November WBD sales tied to an October 7 trade date filed across multiple weeks; week-over-week “new WBD rows” were staggered disclosure, not a fresh congressional decision each Friday. Pair with ticker research across chambers when Senate lines eventually join the same name.
-
Contrast signal mix without treating labels as trades. Log how many rows carried Worth watching vs Normal labels each week. A high batch week can inflate notable flags simply because more lines entered the scoring window. Open row detail and read signal reasons before you compare week A to week B in external notes.
-
Close with a proportionality verdict. Ask whether week B changes anything you would cite publicly. If week B is a one-row follow-up after a seventy-seven-row batch, archive the comparison and wait—quiet weeks after dumps are normal PTR cadence. If concentration or lag shifted materially, route one or two rows through verification before sharing.
Examples: November 2026 week shape (not a trade call)
The table summarizes deduplicated filing-window stats already documented in ProBors snapshot posts for adjacent November weeks. Use it as a template for your own memo columns—do not treat percentages as market forecasts.
| Filing window (2026) | Deduplicated rows | Politicians (≥1 line) | House / Senate | Purchase / sale mix (approx.) | Notable pattern |
|---|---|---|---|---|---|
| Early Nov (Oct 28–Nov 4 filings) | 17 | 7 | 17 / 0 | 10 purchases, 7 sales | Spread across members; small week |
| Mid Nov (Nov 9–12 filings) | 77 | 4 | 77 / 0 | 41 purchases, 36 sales | Two dominant House batches |
| Late Nov (Nov 13–20 filings) | 1 | 1 | 1 / 0 | 1 sale | Quiet follow-up after batch week |
Row-level illustration (lag vs filing week): Recent filings in ProBors as of November 21, 2026 include Rep. Steve Cohen’s WBD sale (trade date October 7, filed November 16)—the only row in the late-November window—while Rep. Gilbert Cisneros’s November 9 batch belongs to the prior filing week. Same ticker cluster, different filing calendars; comparing weeks without grouping by trade date would overstate “new” WBD activity.
What this does not prove
Week-over-week tables describe public STOCK Act timing and volume, not investment edge. A drop from seventy-seven rows to one does not show Congress stopped trading; it often shows fewer PDFs hit the clerk portal. Repeat ticker lines on staggered filing dates do not prove coordination. Amount fields remain statutory ranges. Signal labels are ProBors triage helpers, not recommendations to buy or sell. None of this is investment advice.
FAQ
How is this different from a weekly disclosure review?
The weekly review answers what filed since your last pass. Back-to-back comparison pairs two windows to study concentration, lag shifts, and repeat tickers—useful after a batch week or when headlines overinterpret a quiet follow-up.
Should filing weeks align to calendar Monday–Sunday?
Pick a consistent rule and keep it. Many researchers use filing-date ranges that match their Friday review anchor. Consistency matters more than the exact calendar cut.
What if Senate rows break a House-only pattern?
Label the change explicitly—Senate periodic reports often carry older trade dates inside a fresh filing week. Split Senate rows into their own subsection before comparing volume to the prior House-heavy week. See stale Senate batch investigation.
Can I compare more than two weeks?
Yes. Stack three or four windows when you track a prolonged ticker cluster (same trade date, multiple filing weeks). Stop when additional weeks repeat the same lag story without new politicians.
Where do I check whether a quiet week is ingestion vs truly empty?
Open ProBors status for ingestion health. A healthy sync with no new House PDFs still produces a low-row week—that is different from a prolonged outage.
Compare disclosure weeks with less noise
Sort congressional trades by filing date, filter by chamber, and open original PTR links on ProBors.
Get startedRelated reading
- Congress trades filed early November 2026
- Congress trades filed mid-November 2026
- Congress trades filed late November 2026
- How to screen congress trades by filing lag
- How to read politician trade disclosures
Sources
- House Ethics — Financial disclosure (STOCK Act)
- Senate Select Committee on Ethics — Financial disclosure
- STOCK Act (Pub. L. 112-105) — Congress.gov overview
- House Clerk — Financial disclosure publications
- Rows were checked in ProBors and should be verified against the original filing.
Sources & methodology
Last updated:
ProBors uses public disclosure records, SEC filings, House and Senate financial disclosure portals, market data, and in-product workflow checks. Articles are written as research education, not investment advice.